In some leagues there’s no hope for a championship. In others, your team might have a better shot.
It’s the ultimate dream of every fan of a team sport: your favourite club takes home the league’s championship at the end of a season.
But, let’s face it: if you were a St. Louis Browns fan in the first half of the 20th century, you had about a 99% chance of your team finishing about 88 games out of first place while the New York Yankees took home another World Series trophy. (The Browns appeared in exactly one World Series, in the middle of World War II, moved to Baltimore about a decade later, and have found more success in Maryland.)
Of course, we can also point to the near century of pain endured by fans of the Boston Red Sox and the Chicago Cubs . It’s hard to control for curses even though we don’t actually believe in curses.
The question of parity has long been a fraught one in baseball. There have been a few minor dynasties in the sport over the last 30 years. With the Dodgers deferring salaries that are worth almost as much as some franchises to collect the best players in the game, and then on top of it landing Roki Sasaki after months of misdirection and nonsense from both his agent and from a lot of baseball media, including Tigers’ beat writers who treated this like a laudable free agent pursuit, the question is again at the forefront of many people’s minds.
Research Question
Out of the four major professional sports leagues in North America, which one has the most parity in terms of championship-winners? What about for teams appearing in that league’s championship final?
Methodology
The four leagues studied were:
- Major League Baseball (MLB)
- National Football League (NFL)
- National Hockey League (NHL)
- National Basketball Association (NBA)
(Sorry, Big-League Monster-Trucking and Professional Shirling , maybe next time.)
I gathered information about which team won each league’s championship and which was the runner-up for every year from 1995 onwards. This means it includes the Super Bowl played in 1995, which followed the 1994 season, and the same for the Stanley Cup in 1995 following the 1994-95 season. I chose this year as a cutoff for a few reasons:
- From 1995 through 2024, that gives you thirty years’ worth of championships. Surely something that happened from, say, 1991 through 1994 couldn’t still be in a fan’s memory? (Whoops, sorry, Buffalo Bills fans.)
- Two major sports leagues, MLB and NHL, suffered through labour disruptions in 1994 that caused those leagues’ power structures to shift afterwards. I realize an argument could also be made that the NHL changed more fundamentally after its 2004-05 lockout season and the ensuing salary cap, but this seemed like a reasonable cutoff year for both those leagues to me.
- Do Sacramento Kings fans really care if their distant predecessors, the Rochester Royals, won the NBA title in 1951? Maybe a handful do, but not many.
I also had to reckon with the fact that franchises have moved since 1995, and fan bases and/or markets haven’t always had a team there. Here’s what I did:
- Since the Montreal Expos played in la belle province through 2004, I included both Montreal and Washington in my list as separate markets.
- I combined both Cleveland Browns teams, and the Houston Oilers and Texans . I separated-out the Oakland and Los Angeles Raiders, Los Angeles and St. Louis Rams, and the San Diego and Los Angeles Chargers . I left out the Las Vegas Raiders as they’ve only been around for a couple of years.
- For the NHL, since Arizona/Phoenix and Atlanta had teams for most of this timespan, I included them. I excluded Utah, Hartford and Quebec City because they only have/had teams for a couple of years.
- In the NBA I included Seattle but excluded Vancouver, whose Grizzlies really didn’t stick around in the Great White North too long, eh? I also merged both Charlotte franchises (Bobcats and both Hornets), and both New Orleans teams (the relocated Hornets and the Pelicans).
For us Detroit Tigers fans, since 1995 we’ve seen our team appear in two World Series but win neither. That’s gotta count for something, right? To incorporate this, I created an index which awards 3 points for a championship victory, and 1 point for appearing in the championship series or in football, the Super Bowl. Would watching the Tigers win the 2012 World Series have been three times better than watching them just play in the thing? I really can’t say. Feels like it might be 10 times better after watching the Tigers get trucked in ‘06 and ‘12, but that’s irrelevant. The point is to take a look at parity.
Alright, on to the numbers.
Results
From 1995 through 2024, three of the leagues had 30 possible championship titles; the NHL only had 29 due to the cancellation of the entire 2004-05 season. That means the mean number of titles is going to be a little bit less for the NHL (by about 0.03, or 1/32), but the other numbers shouldn’t be affected that much. I’ve also included the percentage of teams/markets that have had at least one title or one appearance.

On average, a given market has had a little under one championship since the mid-1990s, and over half of MLB markets have experienced a title. By contrast, just a little over two-fifths of NBA markets have been able to celebrate, and the standard deviation (SD) of NBA titles per team is the largest of the four leagues.
If we expand this out to include teams that have made it into the finals, over three-quarters of NHL markets have had their team in the Stanley Cup finals (heh, Leafs) but only a bit more than two-thirds of NFL teams have seen a Super Bowl.
The numbers that jump out at me here are the standard deviations in the Points column. For the NHL, there’s a lot more parity in terms of teams getting to the Stanley Cup Finals than for other sports’ championship finals. The NBA has the largest SD, with NBA Finals appearances dominated by a few heavy hitters such as the Lakers , Spurs, Warriors and Heat.
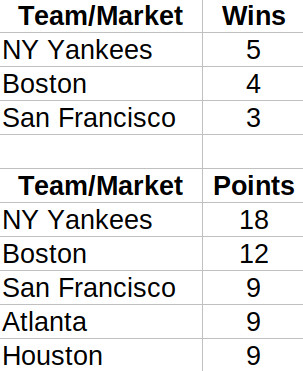
Here’s the leaderboard for each league’s championship winners and fan-points since 1995. First, MLB:

This includes the Yankees winning three straight World Series titles in the late ‘90s, and the Red Sox’ (and their fans’) recent run of just being, well, pretty insufferable.
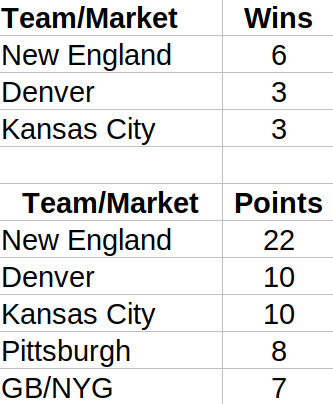
Now, the NFL:

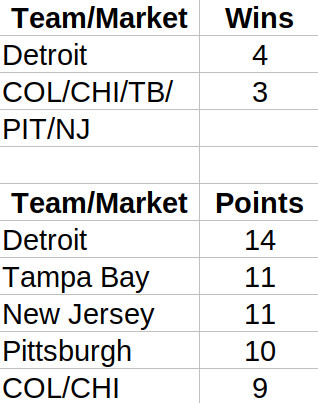
What’s that about Bostonians being annoying? Add this to the pile. Now, the NHL:

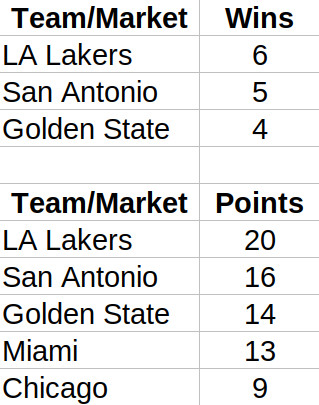
How about that, the Red Wings have the most titles since 1995; yes, it’s been a while, but holy moly, did they have a good run in the ‘90s and ’00s. Tellingly, though, five teams have each won three Stanley Cups, and I think that’s probably where a good chunk of the parity comes from. Finally, the NBA:

That’s a top-heavy league, and it’s easy to forget just how good San Antonio was, but there they are.
Conclusions
If you’re looking at appearances in a championship final as a measuring stick, the NHL has the most parity and the NBA has the least parity. But if your only goal is to win championships — after all, as Enzo Ferrari once opined, “Second place is first loser” — it’s a little harder question to answer. The parity champs could arguably be the NHL again, or even MLB if you look at it another way.
Are the Dodgers unbeatable now that they have Shohei, Yoshinobu Yamamoto, Blake Snell, and now an outstanding pitching prospect who will potentially develop into an ace in Rokie Sasaki? No, but while we can also turn to some low payroll teams whose ownership groups never even make a series effort, there’s clearly a problem here that is going getting worse. Fortunately, baseball and sports in general have a way of deflating hubris, but the imbalance now is getting out of control.
About the only thing we know for sure is that the Lions aren’t going to the Super Bowl this year, which is a pretty giant bummer for some of us.
